Fading Liquidation Cascades: A Crypto Scalper That Survived Walk-Forward
Liquidation cascades create predictable overshoots. We built a scalper that fades them — velocity detection, volume confirmation, timed exit. SOL and ETH survived. BTC did not. Charts, data, honest caveats.
The Premise
Leveraged trader gets liquidated. Exchange market-sells their position. Price drops. Drop triggers more liquidations. Cascade feeds itself until the leverage is flushed.
The overshoot — how far price travels past fair value during the flush — is the edge. Nobody decided the asset was worth less. A margin engine decided a position had to die. Once the forced selling stops, price drifts back.
Mean-reversion with a structural cause. We built a scalper that fades it.
What a Cascade Looks Like
SOL, one-minute bars. A real one from the data:
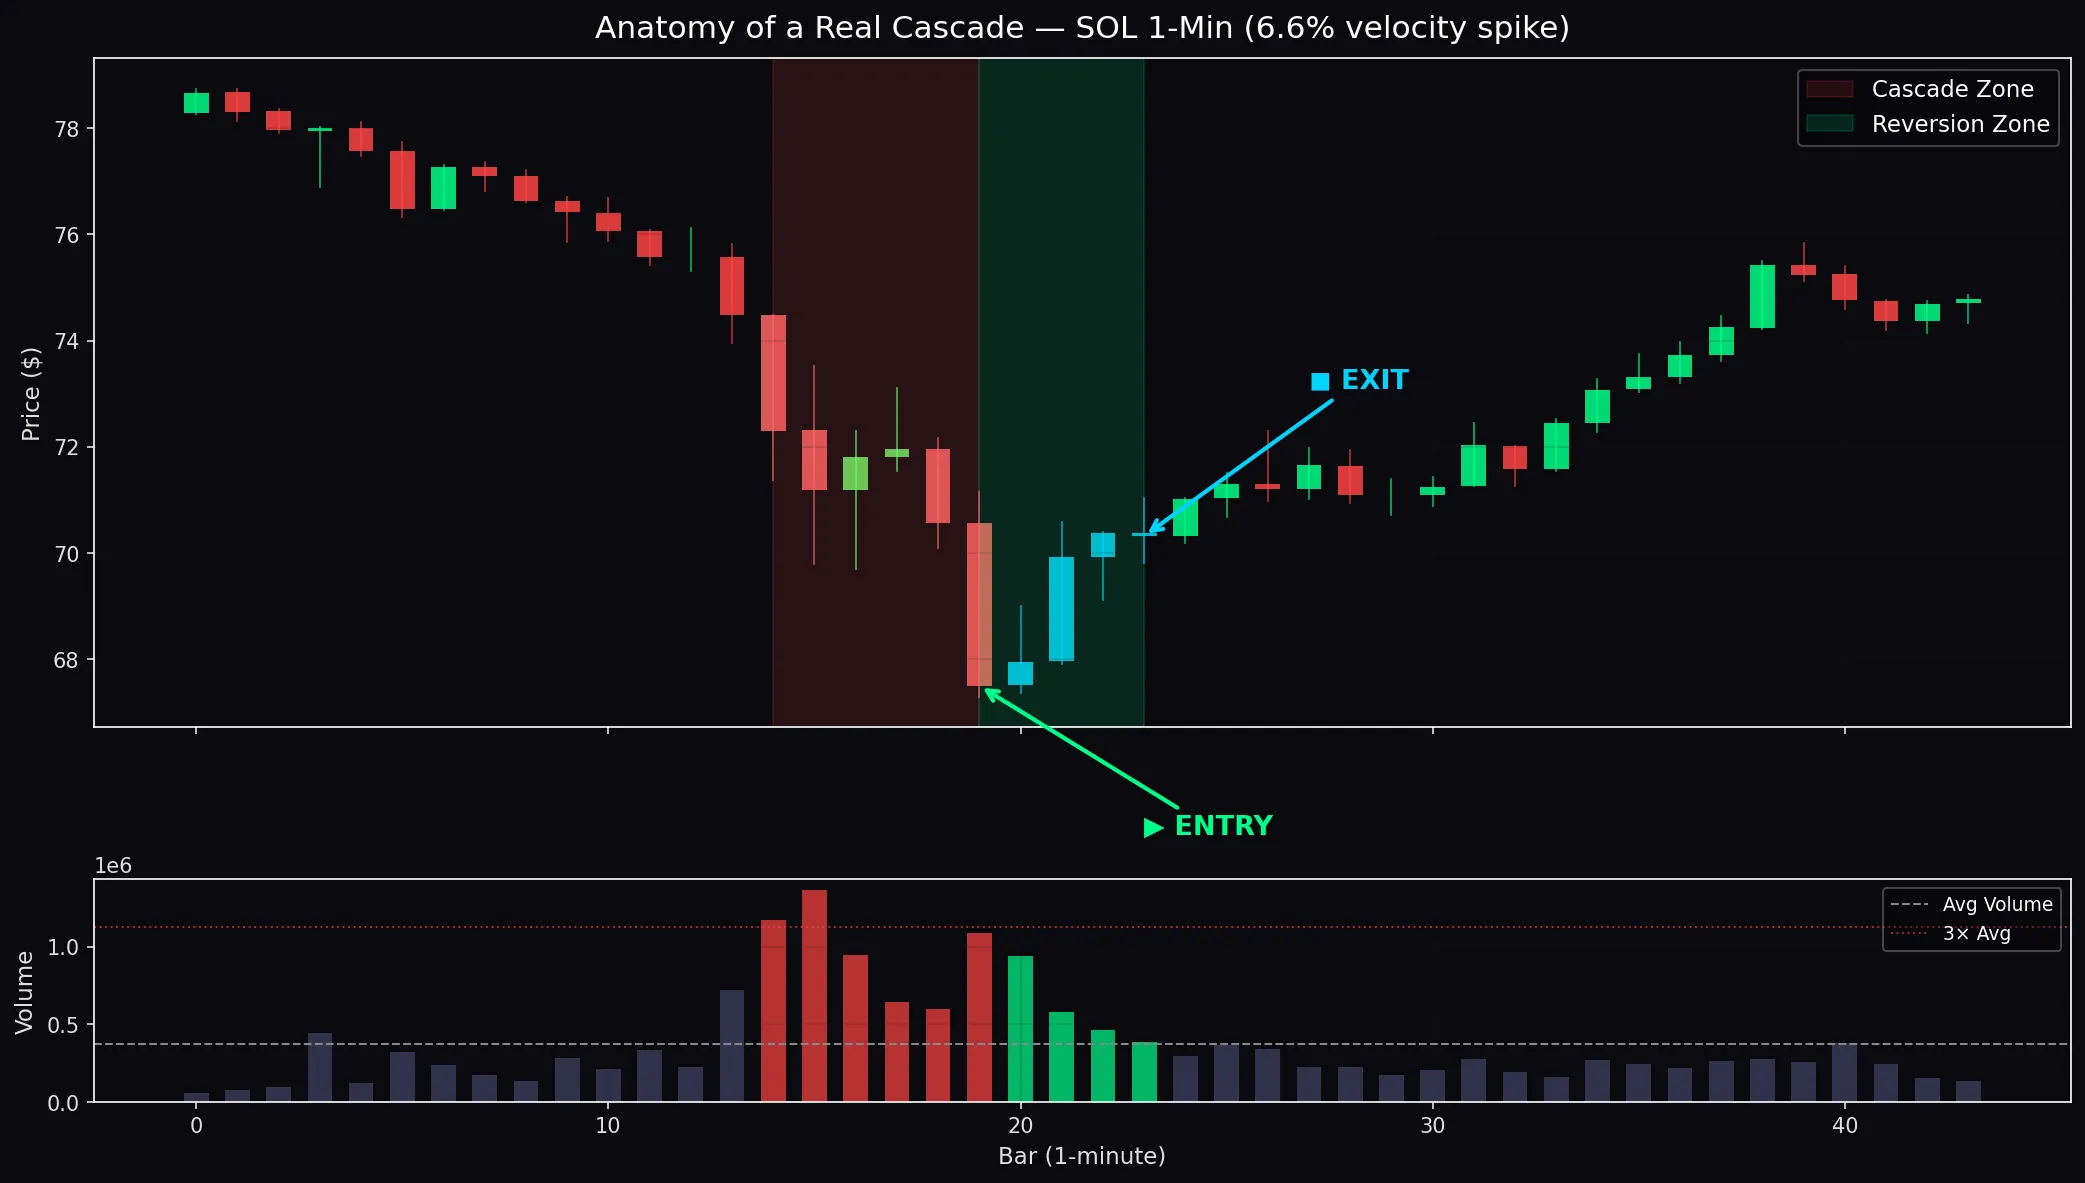
Red zone: rapid displacement across several bars, volume spike well above daily average. Green zone: order book refills, price drifts back. Entry at cascade bottom, exit on a timer.
Not theory. This is what the data looks like.
Detection
Two filters. One-minute bars.
Velocity. Cumulative displacement over 5 bars. Not a single candle — cascades unfold across minutes. A wick catches one. We catch the staircase.
Volume. 3× above recent average. Velocity without volume is a gap or thin book. Velocity with volume means something mechanical happened — liquidity consumed, not absent.
Both fire simultaneously → enter opposite direction. The bet: overshoot, partial retrace within minutes.
Exit is purely time-based. Sub-5-minute hold, then close. We tested TP/SL combinations. All worse. The timed exit respects the physics: order books refill at roughly constant rate. Reversion duration is more stable than reversion magnitude.
How We Got Here
Six months of failure. 38 strategies tested, 36 dead. Entropy, chaos theory, price action, information theory — all killed by tick data, walk-forward, or cross-asset testing.
The surviving insight: stop predicting price. Find predictable inefficiency. Liquidation cascades are mechanical. They exist because of exchange plumbing, not chart patterns. Structural edges survive longer — they require mechanism change to disappear.
Pipeline:
- 800 days of 1-min data per asset (~1.15M bars per coin, 3.5M total)
- Calibrate first — profile real cascade distributions before picking thresholds
- Full parameter sweep — velocity, hold period, volume multiplier. No cherry-picking
- Walk-forward: 180d train / 180d OOS / 90d step = 5 windows. All must be green
- Per-asset autopsy — not all liquidation profiles are equal
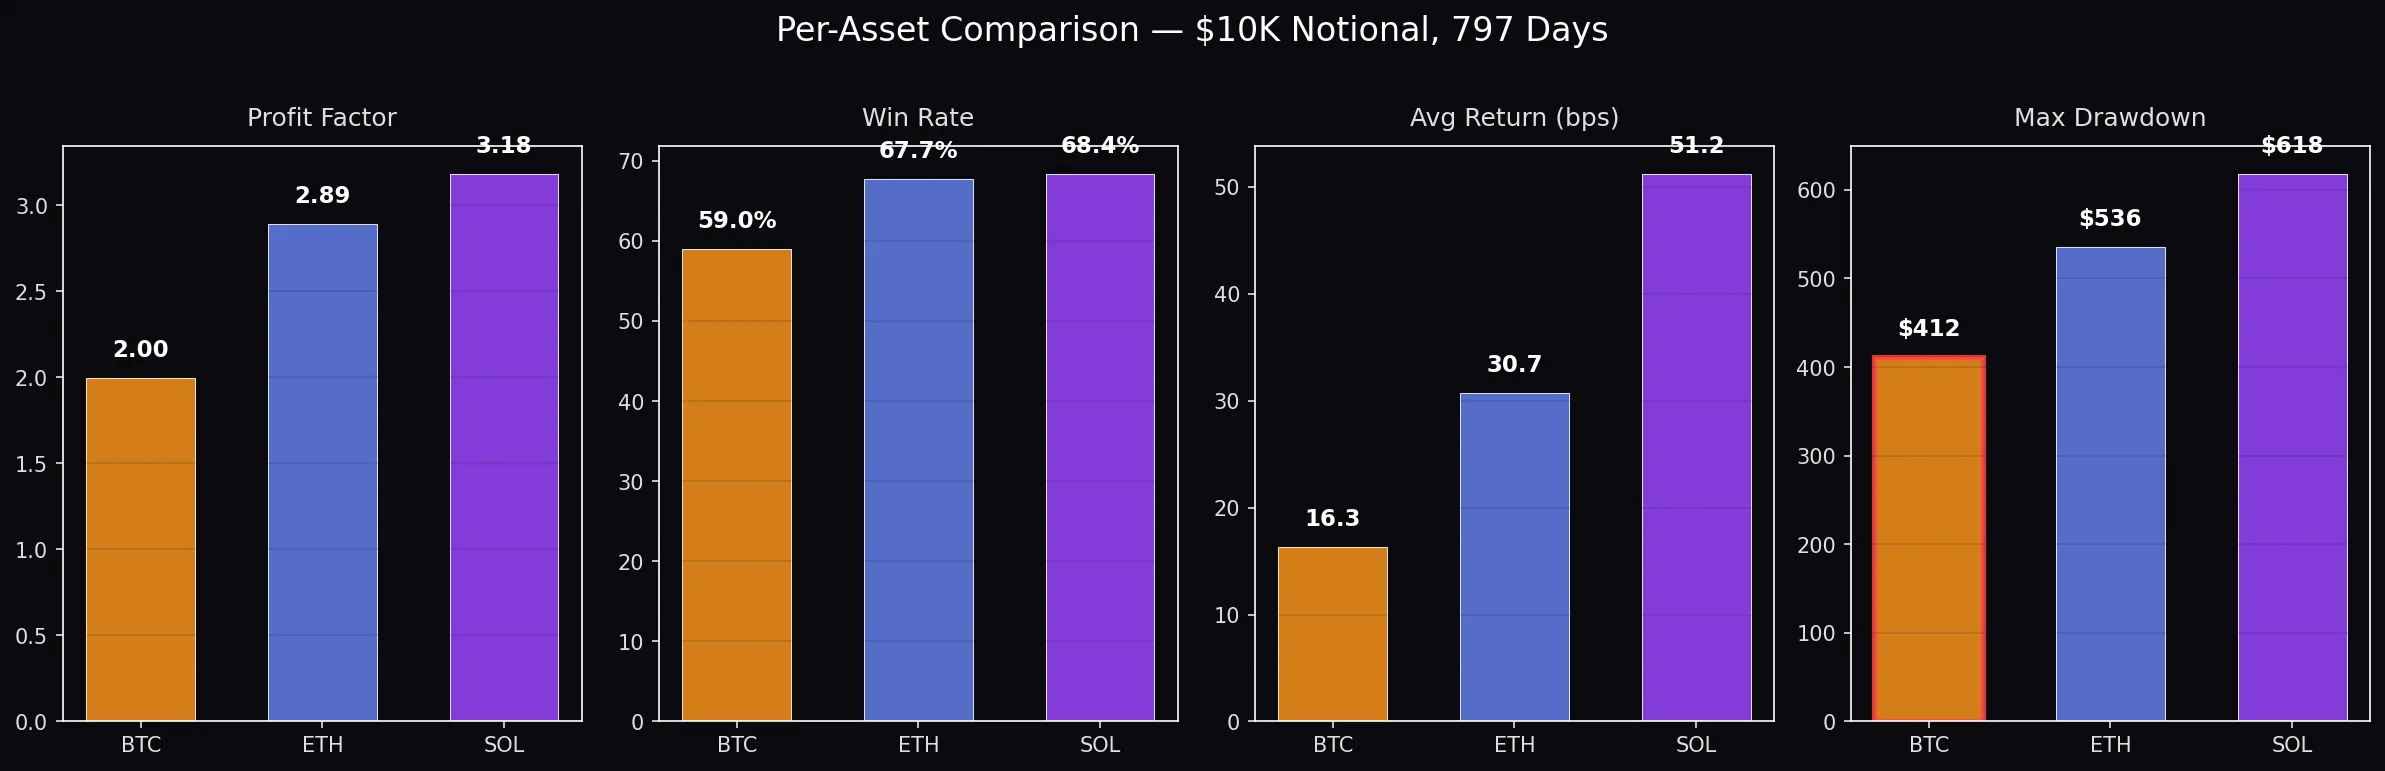
Three Assets, Three Stories
Same signal. Same logic. Three very different outcomes.
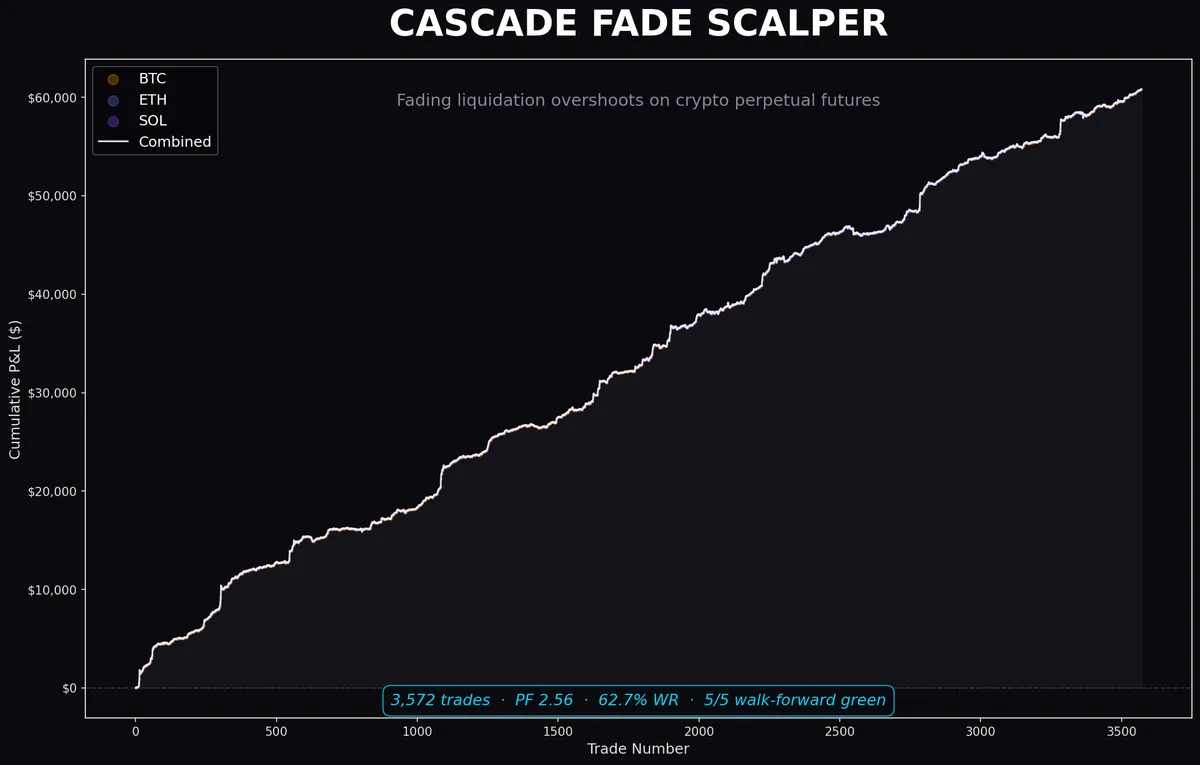
Equity curves:
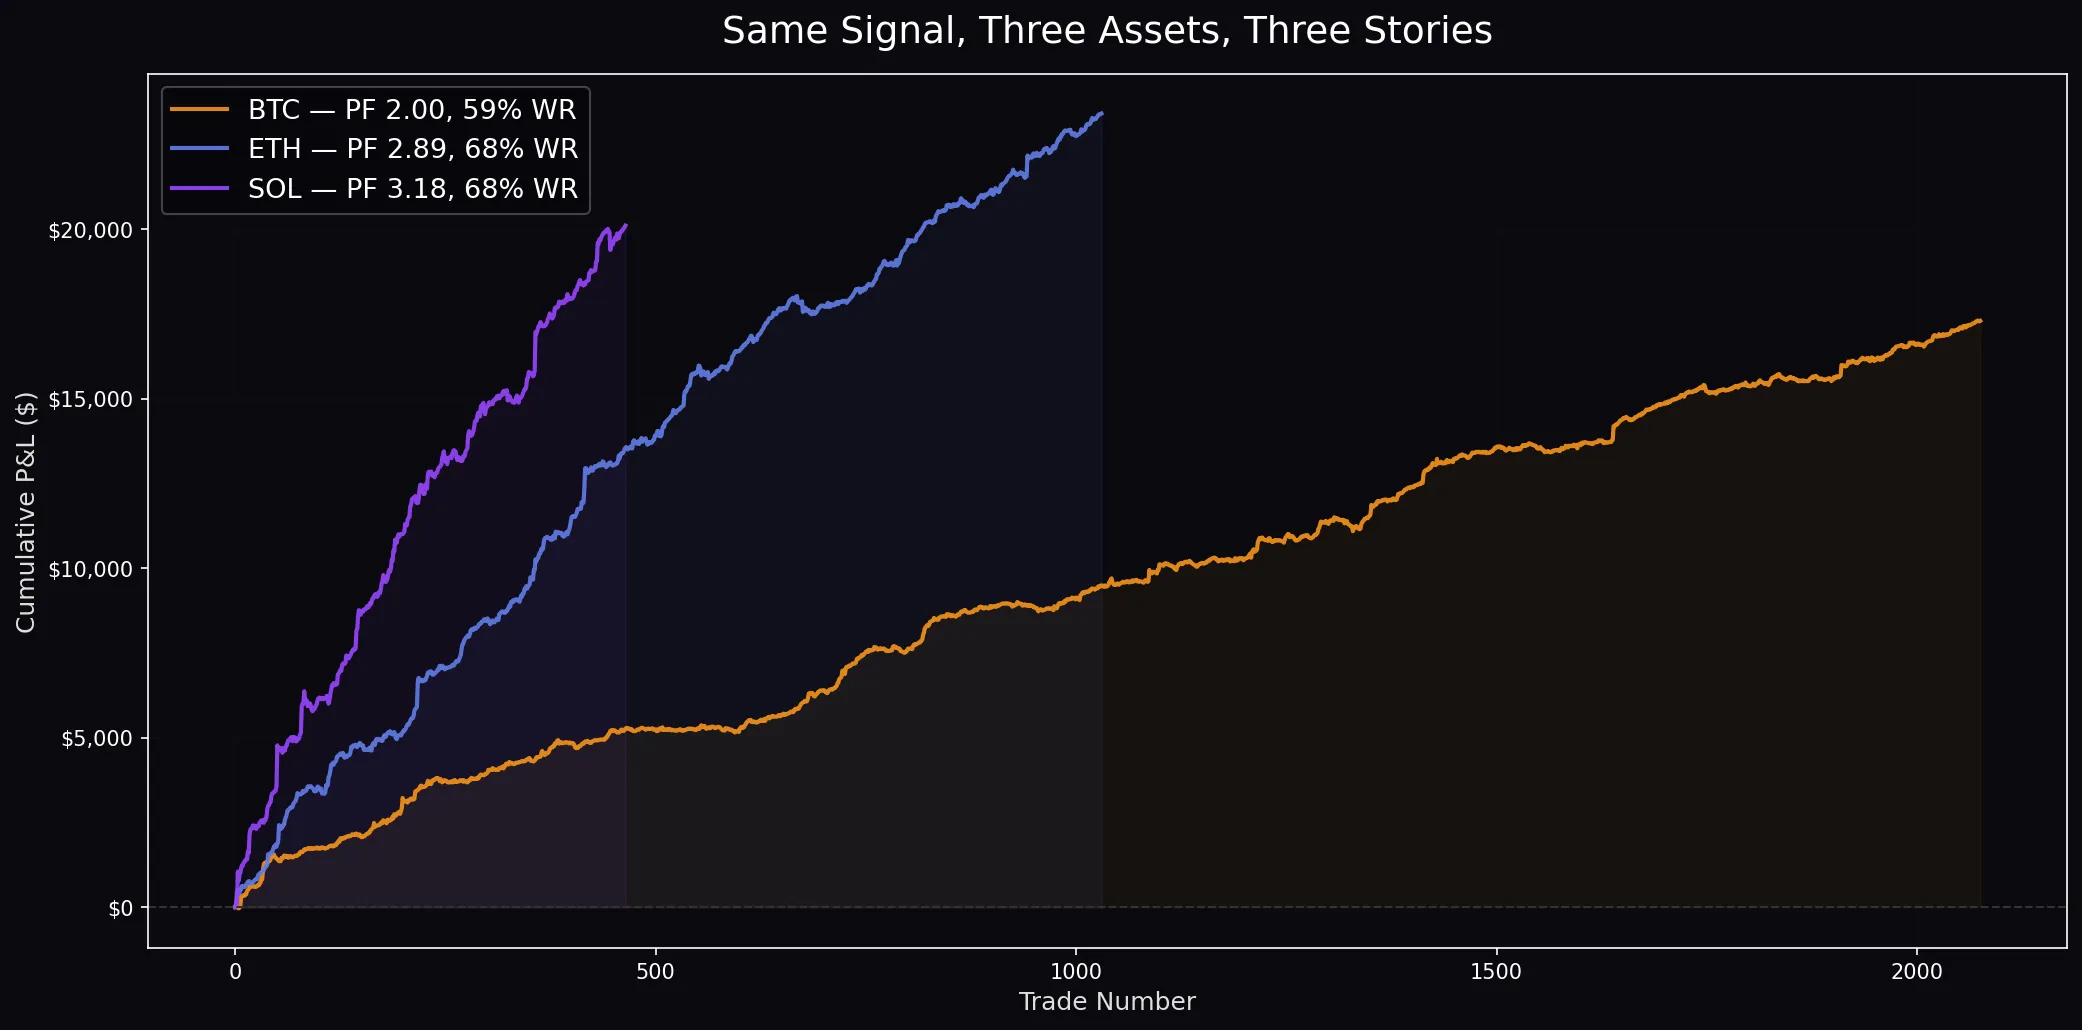
ETH — Cleanest Cascades
When ETH flushes, it overshoots by a consistent amount and reverts predictably. Highest win rate (~67%), PF ~2.9, contained drawdowns. ~1.3 signals/day.
Lower frequency than SOL. ETH leverage ratios are lower, cascades less common.
SOL — Most Violent, Most Profitable
SOL surprised us. Most total profit (~50% more than ETH absolute), PF above 2.5, ~1.6 signals/day. Thinner books, more retail leverage, meme-coin adjacency creating panic. That violence is exactly what this strategy needs.
BTC — Dead
PF ~1.5. Too thin for real execution costs. Max drawdown 8× worse than ETH or SOL. BTC’s order book is deeper — forced selling gets absorbed more efficiently. Overshoots shrink relative to spread. Some walk-forward windows borderline. Inconsistency is a red flag.
Cut. The math didn’t earn its seat.
Threshold Sweep
This is what convinced us the edge is structural, not fitted:
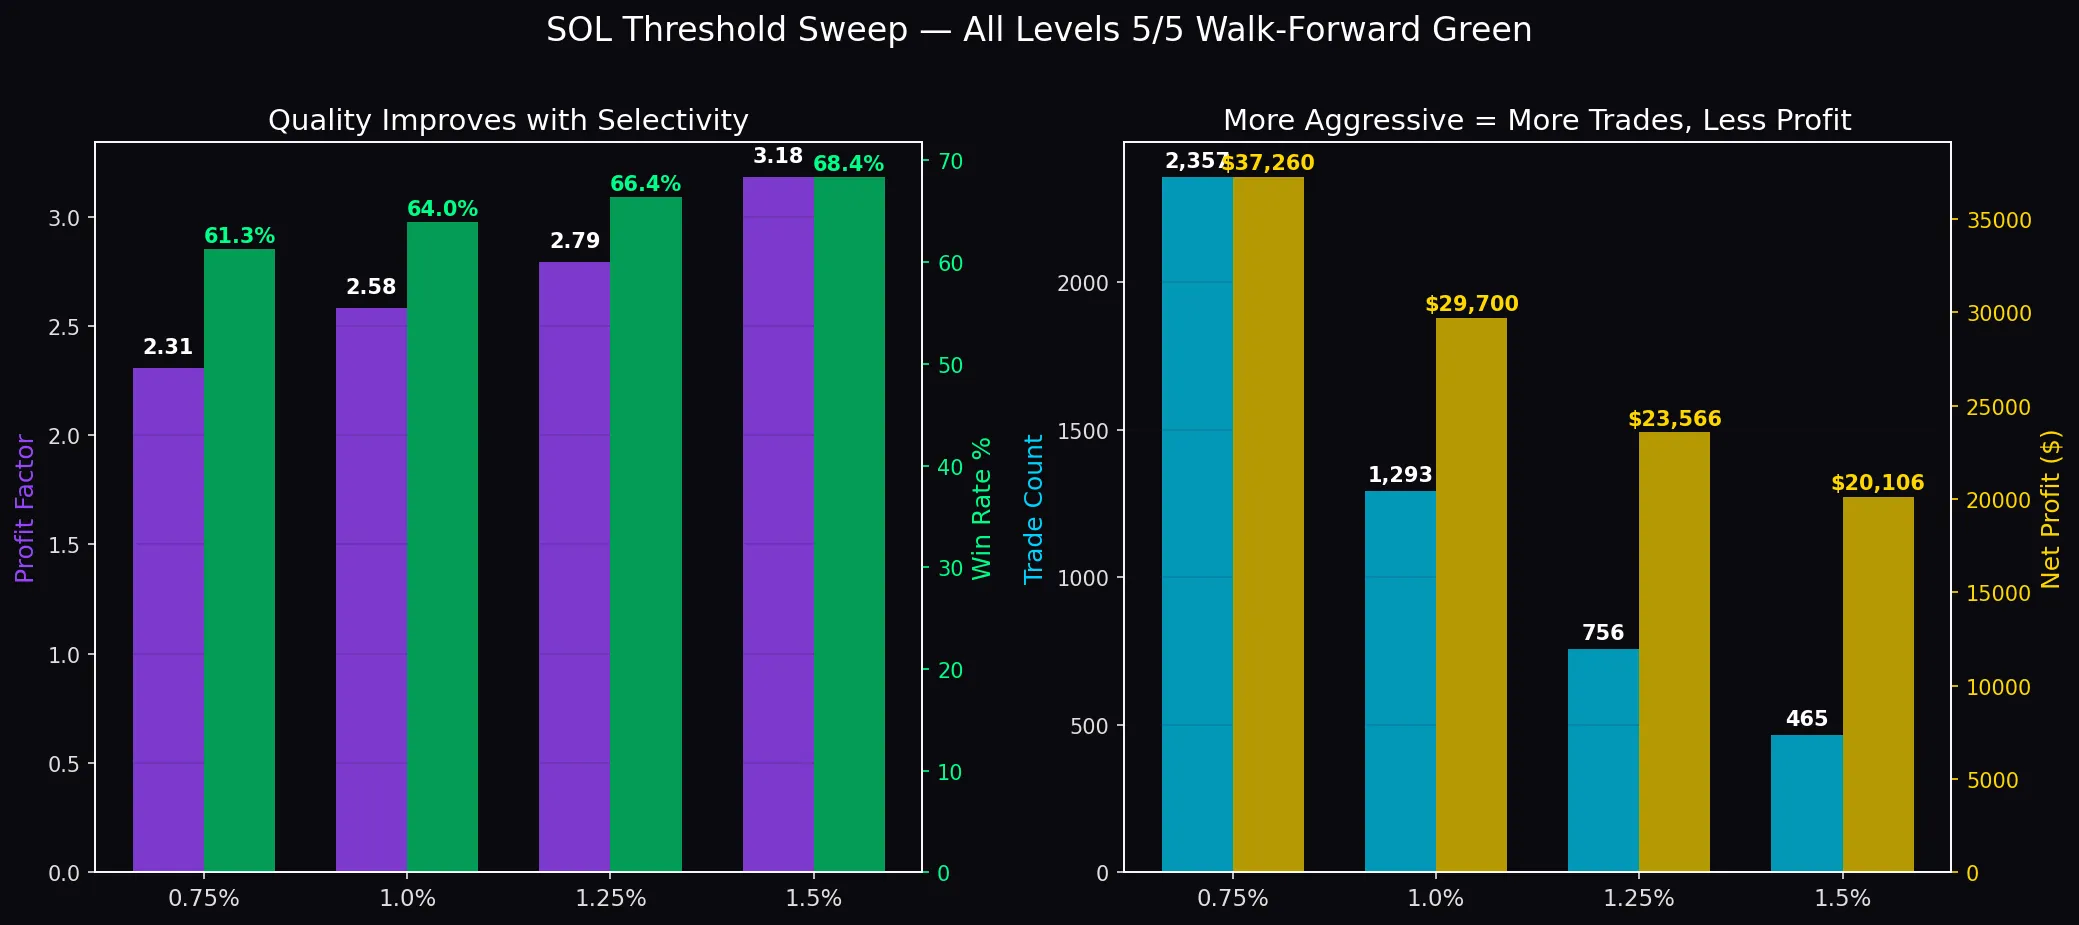
Four velocity thresholds, aggressive to conservative. Every level passed all five walk-forward windows. Smooth, monotonic: tighter filters → fewer trades, higher win rates, better PFs. No magic numbers. No cliffs. No discontinuities.
Curve-fitted strategies have one sweet spot surrounded by garbage. Structural edges have a plateau. This is a plateau.
Walk-forward detail:
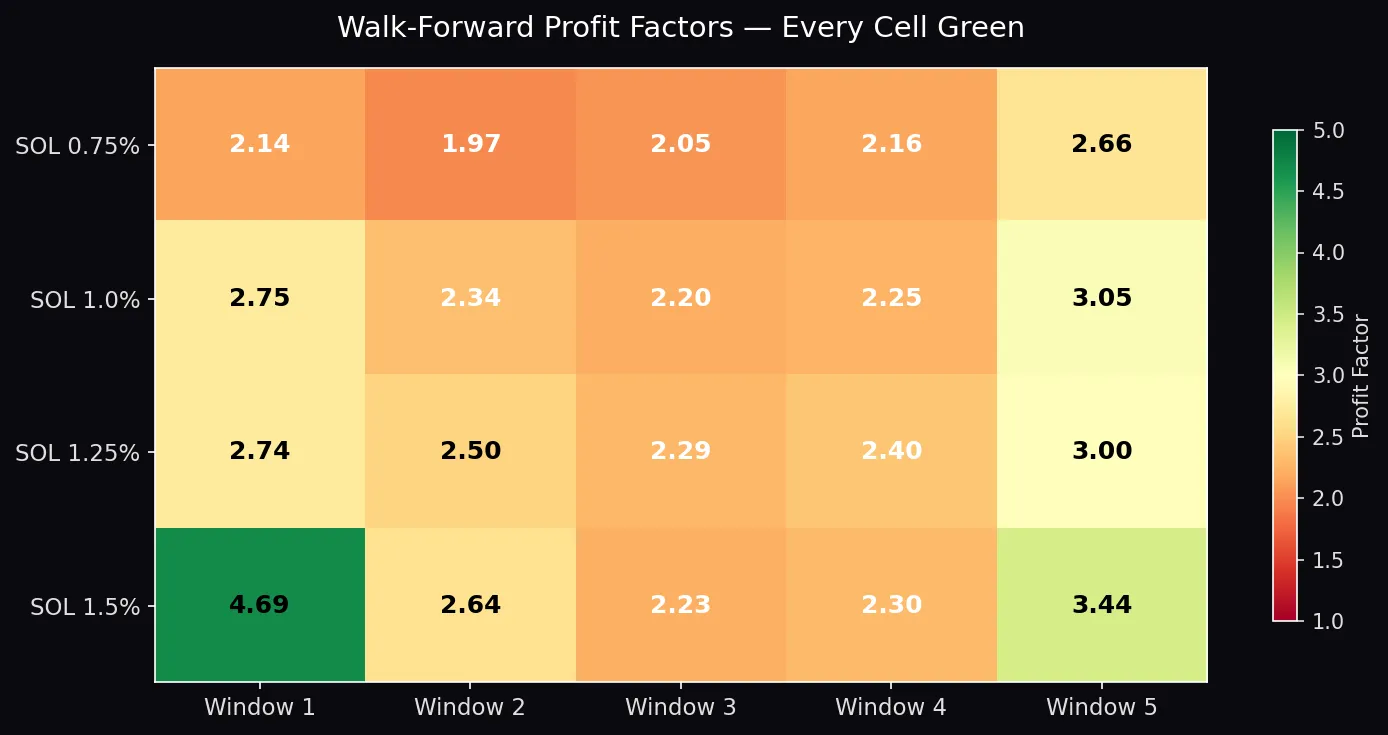
Every cell above 1.0. Most above 2.0. Weakest window: PF 1.97 — still comfortably profitable. No threshold level has a losing window.
What Could Kill This
Fill quality. Edge measured in basis points. If execution eats 5-10 bps through slippage, spread, and fees, it goes marginal. Backtest includes realistic taker fees. Simulated slippage ≠ real slippage. Only live validates this.
Regime dependence. SOL went through a low-vol stretch — detector fired zero times over several days. Prolonged low-vol = near-zero frequency. You don’t lose money. You just don’t trade.
Mechanism change. Exchanges change liquidation processing — batching, Dutch auctions, circuit breakers — cascade signature changes. Binance has iterated before.
Overcrowding. Enough participants fade cascades, overshoots shrink. Classic alpha decay. Unmeasurable short of watching the edge degrade live.
Live: The Honest Part
Cascade Fade is live on Hyperliquid. SOL + ETH. $298 capital.
The first two weeks were phantom trading. Signals fired, “orders” went out, P&L tracked — all fake. A szDecimals mismatch meant the executor was submitting sizes the exchange silently rejected. The bot thought it was trading. Hyperliquid thought otherwise. Two weeks of ghost fills before we caught it.
Once the decimal bug was fixed, real fills came: +$0.51 on $200 notional. Small. Correct. The strategy that won BGCSP operational champion — 68.44% win rate, profit factor 3.20 — placed its first real trade and made half a dollar.
That’s what honest live results look like. Not a screenshot of +4000%. Half a dollar on two hundred, after two weeks of talking to yourself.
The executor runs as a systemd service streaming 1-min candles via WebSocket. Signal fires → market order on crypto perps → hold → close → Discord notification.
- Data source ≠ execution venue. Deepest feed for signals, better fees for execution
- Daily loss limit. Hard kill switch
- Conservative sizing. Validation, not profit. Do real fills match backtest?
- Auto-restart. Survives crashes, reconnects, resumes
~3 combined signals per day at current thresholds.
Scoreboard
- 38 strategies tested. 36 dead.
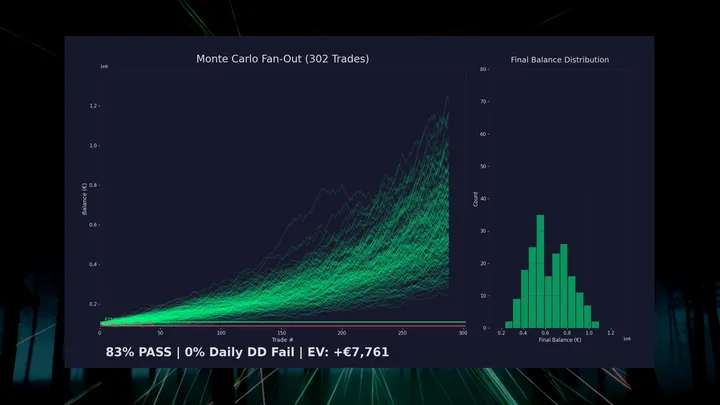
- 2 survivors. IPDA CE on forex (PF 1.21, live since February). Cascade Fade on crypto (backtest PF ~2.5, live as of March).
- Best backtest numbers we’ve ever produced. Which is exactly why we’re paranoid. The walk-forward robustness and parameter plateau earned deployment. The market decides whether the edge is real.
Lessons
- Trade the mechanism, not the pattern. Liquidation cascades are structural. Structural edges outlive statistical ones.
- Parameter plateaus > parameter peaks. Narrow edge = noise.
- Asset selection is part of the edge. Same signal, three results. BTC died. SOL thrived.
- Time-based exits beat target-based exits when the edge comes from a known physical process. Match the exit to the process.
- The graveyard teaches more than the trophy case. 36 dead strategies narrowed the search to: mechanical processes with observable signatures.
- Check your decimals. Two weeks of phantom trading. The signal always worked. The execution wasn’t submitting.
Watch the Build
From dry-run validation to the szDecimals bug to the first real fills on Hyperliquid. Four minutes.
Part of our open research series. We publish everything — winners and losers. The graveyard is the product.