38 Strategies Tested. 2 Survived.
The honest, updated results from testing 38 trading strategies across entropy, price action, regime detection, chaos theory, crypto microstructure, and signal processing. 36 are dead. The graveyard IS the content.
The Graveyard Keeps Growing
Every quant team publishes winners. We publish the corpses.
This post started as “31 strategies, 4 survivors.” One month later: 38 tested, 36 dead. The graveyard grew faster than the trophy case. Two strategies crawled out. The rest got buried with full autopsy reports.
Survivorship bias is a hell of a drug. If you only study winners, you’re learning fiction. Here’s the full body count — every strategy we actually ran, with real numbers, real failures, and what each corpse taught us on the way down.
How We Kill Strategies
Same firing squad for everyone:
- Data: EURUSD hourly (yfinance, 2 years), Darwinex tick data (42M ticks EURUSD, 28.8M ticks EURGBP), MT5 for walk-forward
- Entry: Next bar open after signal. No exceptions. No “enter on signal close” nonsense.
- Validation: Walk-forward with fixed parameters. No peeking at out-of-sample, no retroactive tuning.
- SL/TP: Checked against high/low, not close. Close-based checks are how you fake a 4× profit factor.
- Tick verification: Any OHLC-only result gets a “suspect” stamp until ticks confirm it.
- Minimum bar: If trade count is too thin for statistical significance, we say so instead of pretending 34 trades proves anything.
# Backtest smell checklist — if you skip any, your results are fiction
REQUIRED = [
    'entry_at_next_bar_open',      # no look-ahead bias
    'sl_tp_vs_high_low',           # not close-based
    'walk_forward_fixed_params',   # no in-sample optimization
    'transaction_costs_included',  # 1 pip slippage minimum
    'tick_data_verification',      # OHLC lies. always verify.
    'minimum_trade_count_noted',   # 44 trades is noise, not alpha
    'cross_pair_validation',       # single-pair results are suspect
]
The Two That Wouldn’t Die
Out of 38, two survived every round of “try to kill it.”
IPDA Consequent Encroachment — 30-minute Fair Value Gaps, filtered by session (London Open 07–11, NY Open 13–17 UTC), 1.5:1 R:R. MT5 rebacktest: 401 trades, 51.9% WR, +350.6 pips, PF 1.21. Not glamorous. But this thing survived five progressive honesty rounds — tick verification, session filtering, spread adjustment, R:R sweep, wick entry correction. We tried to murder it five different ways and it kept getting back up. That earns cautious deployment.
Live since February 25, 2026. €9,540.23 equity, -4.6% max drawdown, recovering.
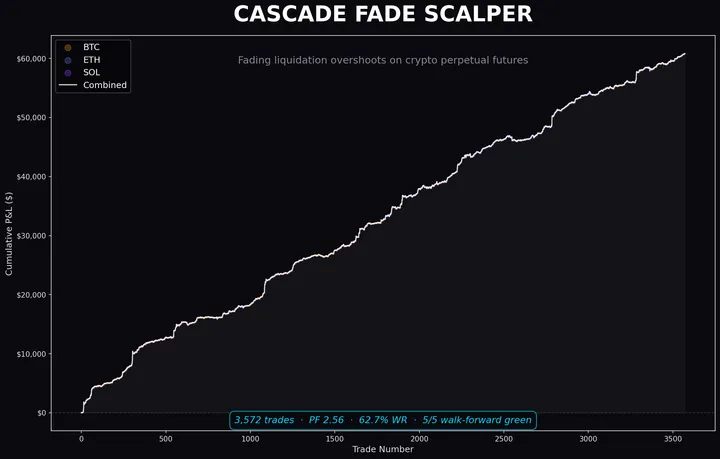
Cascade-Fade Scalper on SOL + ETH — fading liquidation overshoots on crypto perps. Walk-forward PF ~2.5, all five windows green on both assets. BTC dropped out (PF 1.54, drawdown 8× worse — too much reflexivity). SOL robust across every threshold we threw at it. ETH had the highest per-trade quality (~67% WR, PF ~2.9). Live on Hyperliquid since March 7.
Two. Out of thirty-eight. A 94.7% kill rate. If yours is lower, you’re not trying hard enough to break your own work.
The Graveyard
Each one of these looked promising at some point. Each one died for a specific reason. The autopsy reports are more valuable than the survivors.
ECVT — Entropy Collapse Volatility Timing ☠️
Source: Singha 2025 (arXiv:2512.15720). Shannon entropy collapse on forex returns predicts volatility spikes.
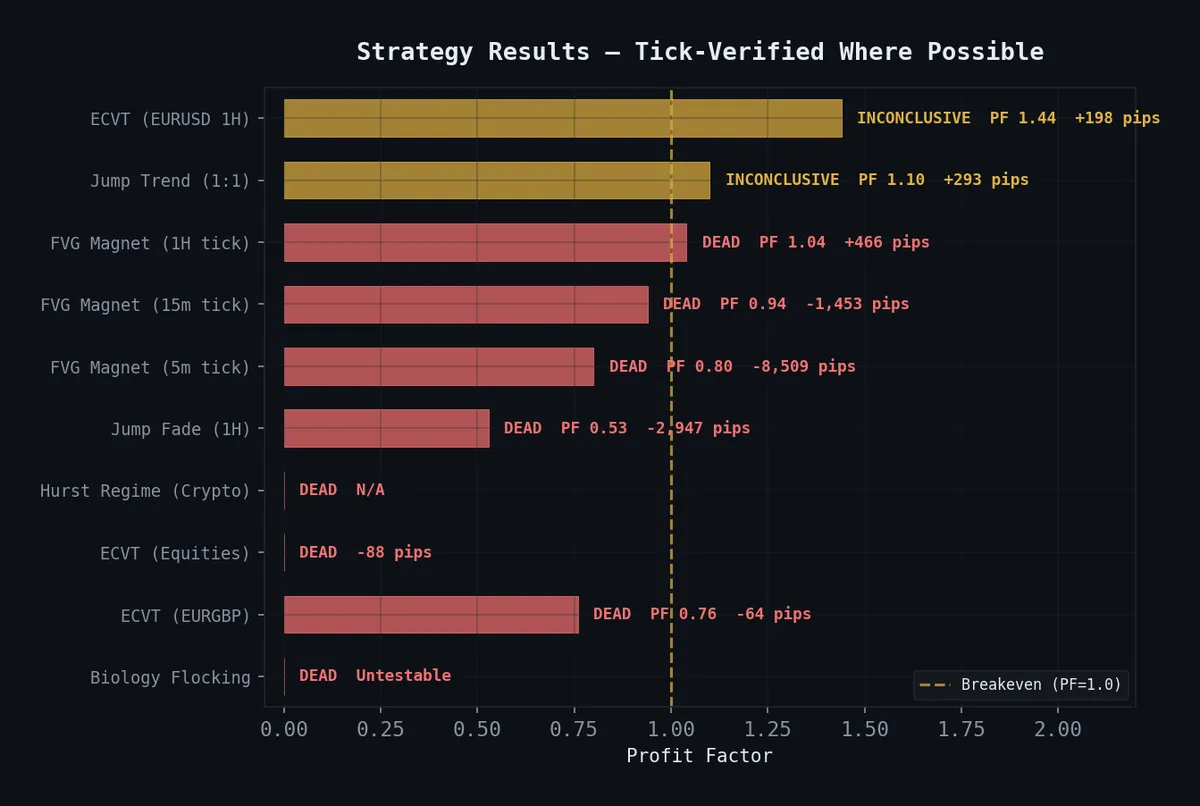
This was the darling. EURUSD 1H: 44 trades, PF 1.44, +198 bps at 41% WR. Respectable. We were excited. Then we tested everything else and the floor opened up.
| Test | Trades | PF | Result |
|---|---|---|---|
| EURUSD 1H | 44 | 1.44 | +198 bps |
| EURGBP 1H | 23 | 0.76 | -64 bps |
| GBPUSD 1H | — | — | -108 bps |
| SPY (equities) | 9 | — | -88 bps, 89% stop-outs |
| Tick data | — | — | -17 bps |
| ECVT + Hurst combo | — | — | -86 bps OOS |
One pair. One timeframe. One data resolution. That’s not an edge — that’s a statistical artifact wearing a lab coat. A strategy that only works on EURUSD 1H OHLC is a strategy that works nowhere. Full autopsy →
Cause of death: Non-transferable, tick-fragile, 44 trades. Looked like science, died like noise.
Jump Trend ☠️
We discovered this by accident — the Jump Fade + Trend composite was bleeding 3,000 pips, but when we decomposed it, the trend component alone showed +293 pips at 55% WR on EURUSD 1H. 601 trades, PF 1.10. Thin, but intriguing.
MT5 walk-forward at 30m demolished it:
- PF 0.79, 40% WR, -207 pips across 65 OOS trades
- 14 unique “best” parameter combinations across 17 walk-forward windows
- 87.5% parameter instability
Fourteen different optimal configs in seventeen windows. The strategy was a weather vane — pointing wherever the last wind blew, never the same direction twice. When optimal parameters change every fold, you’re not finding an edge. You’re fitting noise, one window at a time.
Cause of death: No stable configuration exists. The “edge” was a different hallucination in each window.
FVG — Fair Value Gap Fill ☠️
This one got the most thorough testing because we wanted it to work. Multi-timeframe tick autopsy. A proper funeral.
| Timeframe | Trades | PF | Pips | Verdict |
|---|---|---|---|---|
| OHLC Daily | — | 4.28 | — | FABRICATED — 4× inflation from Close-based SL/TP |
| 4H OHLC | 1,034 | 1.17 | +2,505 | Unverified on tick |
| 1H Tick | 1,504 | 1.04 | +466 | Breakeven |
| 15m Tick | 3,217 | 0.94 | -1,453 | Losing |
| 5m Tick | 6,842 | 0.80 | -8,509 | Dead |
Watch the PF melt as you zoom in. Monotonic degradation from daily to 5m. The daily OHLC result — PF 4.28 — was a complete fabrication. Close-based SL/TP made a losing strategy look four times more profitable than it was. The “optimal” R:R sweep lands at 1.7:1 for a PF of 1.114. That’s not tradeable. That’s the sound of breakeven after fees. Full funeral →
Cause of death: OHLC inflation made a corpse look alive. Tick data performed the actual autopsy.
Holding Pattern ☠️
Hypothesis: bars where price “holds” near a level — tight range, high touch count — predict reversals. OHLC backtest: +91 pips. Encouraging enough to verify.
Tick data: -452 pips.
That’s a sign flip. The entire signal was an artifact of how OHLC bars discretize price. Bar-level “touch detection” counts price tapping against high/low boundaries that are artifacts of the bar period, not real support/resistance levels. In continuous tick flow, those boundaries don’t exist. What looks like “price holding at support” on a bar chart is random noise that happened to fit inside a rectangle.
Cause of death: +91p on bars → -452p on ticks. The signal was an optical illusion.
Asian FVG Raid ☠️
Hypothesis: FVGs from the Asian session get raided during London/NY open. Cherry-picked UTC windows: 70.6% win rate on 34 samples. Looked like a sniper entry.
Full UTC-aligned test: 48.7% WR on 234 samples. Below coin flip.
Thirty-four trades. We almost trusted thirty-four trades. That’s how small-sample inflation works — it hands you a beautiful number on a platter of statistical irrelevance. At 234 properly-aligned trades, the “edge” doesn’t just shrink. It evaporates.
Cause of death: 34 → 234 samples. The signal was a rounding error that didn’t survive more data.
Cascade-Fade (Crypto Perps, 5m+ holds) ☠️
Liquidation cascades on crypto perpetuals create mean-reversion opportunities, right? When cascading liquidations push price past fair value, fade back. Simple physics.
Wrong physics. At 5-minute+ holds, cascades don’t mean-revert. They self-reinforce. Liquidation begets liquidation begets liquidation. Fading a cascade at that timescale is stepping in front of a snowball rolling downhill. 50% WR was fee-negative after funding costs.
The wrinkle: the underlying signal does work at 1–3 minute holds on SOL with a simpler OHLCV proxy (5-bar velocity + 3× volume spike). Walk-forward PF 1.44–2.68 at mid-price fills. Same idea, different timescale, radically different outcome. That became the Cascade-Fade Scalper.
Cause of death (5m+): Cascades amplify. They don’t revert. The physics reverses at the wrong timescale.
PSO Plateau ☠️
Particle Swarm Optimization to find parameter “plateaus” — regions where nearby parameters produce similar results, theoretically suggesting robustness over overfitting.
PF = 0 out of sample. Zero. 243 trades spread across a 6-dimensional parameter space. That’s roughly 40 trades per dimension. The “plateaus” were mirages — sparse sampling in high-dimensional space creates fake flat regions the same way low resolution creates fake patterns. We were finding the overfitting equivalent of pareidolia.
Cause of death: 243 trades across 6 parameters. Overfitting cosplaying as robustness.
RQA Chaos Filter ☠️
Recurrence Quantification Analysis from chaos theory — determinism and recurrence rate as trade entry filters. Only trade when markets show deterministic structure, skip random noise.
AUC: 0.556. P-value: 0.26. That’s a coin flip with extra steps. The recurrence metrics added exactly zero predictive information above baseline. Chaos theory applied to markets produced… chaos.
Cause of death: AUC barely above 0.5. Statistically indistinguishable from guessing.
FCIX Liminality ☠️
Financial Complexity Index — identifying “liminal zones” where market complexity transitions between regimes. Avoid trading in unstable transition zones, focus on stable regimes.
The liminal zone had a 72% win rate. The “stable” zones we were supposed to trade performed worse. Our reject zone was the best zone.
This is what happens when a hypothesis sounds so reasonable you forget to check whether it’s backwards. We built an expensive filter that threw away the best trades and kept the worst ones. Elegant theory, inverted reality.
Cause of death: The hypothesis was exactly backwards. Our “danger zone” was where the money lived.
PMM — Performativity Market Making ☠️
Performativity theory applied to crypto — measuring how much order flow creates the price movement it claims to predict (the ε coefficient). Theoretically brilliant. Practically unmeasurable.
The ε signal needs limit order book data at 5-minute resolution. Public crypto data gives funding rates every 8 hours — a 96:1 temporal mismatch. No free historical LOB data exists. Paid feeds run ~$50/month per exchange. Even the EMA proxy we built was circular — “price mean-reverts to its own EMA” isn’t performativity, it’s autocovariance. We measured a mathematical truism and called it alpha.
Cause of death: Beautiful math. Wrong data resolution. Circular proxy. Theory ≠ tradeable, no matter how elegant.
Hurst Exponent Regime Detection ☠️
R/S Hurst with 100-bar lookback on crypto hourly. H > 0.6 flags trending regimes. Filter entries accordingly.
H > 0.6 fired on 100% of bars. Mean H = 0.758. Every single bar was “trending.” This wasn’t a regime filter. This was a light switch permanently stuck on. Directional WR: 48–50% at all thresholds. A pure coin flip with a fancy name.
We caught this one by profiling the signal distribution before running the backtest. If we hadn’t, we’d have wasted weeks optimizing a filter with zero information content. Distribution audit saved us. Full writeup →
Cause of death: 100% signal rate = zero discrimination. A filter that never filters is decoration.
Jump Fade (Gold Daily) ☠️
jump_ratio calibrated on Gold daily, tested on EURUSD hourly. 50–51% WR. Pure noise.
The parameters were fitted to Gold’s daily range distribution. EURUSD hourly has a completely different volatility profile. We were using a thermometer calibrated in Celsius to measure Fahrenheit and wondering why the readings looked wrong.
Cause of death: Non-transferable parameters. Asset-specific calibration doesn’t travel.
Composite: Jump Fade + Trend ☠️
Combined: -3,000 pips. Trend alone: +293 pips.
The composite destroyed a working component. This is the single most important decomposition lesson — if you’re running a multi-signal system and it’s losing money, take it apart. Test each piece alone. The winning signal might be drowning under a dead one.
Cause of death: Composites hide signal. Always decompose.
Biology — Flocking Contagion (Vicsek Φ + SIR R₀) ☠️
Needed a 30+ stock basket to measure flock alignment and contagion dynamics. We were trading single-instrument forex.
We read the paper, got excited about the physics, and forgot to check whether it applied to our asset class. The equivalent of buying a boat engine for a car because the specs looked impressive.
Cause of death: Wrong asset class. Wrong instrument type. Wrong everything except the enthusiasm.
What 36 Corpses Taught Us
These lessons cost more than the two survivors are worth. Each one was extracted from a real failure.
1. Look-ahead bias makes anything look profitable. Entry at next bar open. Always. Every strategy that enters “on signal” is fabricating results. This single rule retroactively killed multiple strategies that looked good in naive backtests.
2. OHLC lies. Ticks don’t. FVG daily: PF 4.28 on OHLC, PF 1.04 on tick. Holding Pattern: +91 pips on bars, -452 pips on ticks. If you haven’t verified on tick data, you have a hypothesis, not a finding. Period.
3. Profile your signal BEFORE backtesting. Hurst fired on 100% of bars. If we’d checked the distribution first, we’d have killed it in 30 seconds instead of 3 days. A signal that’s always on carries zero information. Check your signal distribution before you waste a single compute cycle on backtest runs.
4. Single-pair results are fairy tales. ECVT on EURUSD 1H: +198 bps. On EURGBP: -64 bps. On SPY: -88 bps. Jump Fade on Gold daily: noise on forex hourly. If it only works on one instrument at one timeframe, it doesn’t work. Cross-validation is how you catch liars.
5. Composites hide the working parts. Jump Fade + Trend: -3,000 pips. Trend alone: +293 pips. ECVT + Hurst: -86 bps, worse than either alone. Always decompose. The signal might be alive inside a failing system, suffocated by a dead partner.
6. Walk-forward parameter instability = no edge. Jump Trend selected 14 different “optimal” configurations across 17 windows. If the best parameters change every fold, you’re fitting noise in each window independently. The edge is a mirage that reshapes itself every time you look.
7. Small samples lie with confidence. 44 trades (ECVT) isn’t enough. 34 samples (Asian FVG Raid) showed 70.6% WR that collapsed to 48.7% at 234. PSO used 243 trades across 6 dimensions. If your confidence interval includes zero, your result includes zero. Be honest about sample size or it’ll be honest about you.
The Scoreboard
| Category | Count |
|---|---|
| Strategies tested | 38 |
| Dead | 36 |
| Alive | 2 |
| Kill rate | 94.7% |
The graveyard grows. That’s the whole point.
Most strategies fail. Most backtests lie. Most “edges” are measurement artifacts — how you counted, not what you counted. The two that survived did so by enduring tick verification, session filtering, spread costs, wick entry correction, walk-forward validation, and fill-assumption stress testing. Multiple rounds of “try to murder this.” They didn’t thrive. They just refused to die.
If you’re building trading strategies and your kill rate is below 90%, you’re not trying hard enough to break your own work. The graveyard is the content. The survivors are the footnote.
Code for everything: quant-research. Individual deep-dives: ECVT | FVG | Hurst