Starting from the End: Prop Firm Challenges as Variance Optimization
Most traders approach prop firm challenges looking for alpha. We approached it as a first-passage time problem. €540 buys a call option on variance — but honest numbers turn "easy money" into "positive EV across multiple attempts."
The Wrong Question
Every prop firm forum asks the same thing: What strategy should I use to pass FTMO?
Wrong question. It confuses trading with passing a challenge. One is an open-ended pursuit of edge across infinite time. The other is a bounded first-passage time problem with known barriers, a fixed horizon, and capped downside.
We approached it the other way around. Start from the constraints. Work backwards.
The Structure
An FTMO challenge is structurally a cheap call option on variance:
- Premium: ~€540
- Underlying: €100,000 account
- Strike: Hit +10% before hitting −10%
- Expiry: 30 calendar days
- Max loss: €540. Downside is literally capped at the fee.
You’re not looking for a strategy that makes money forever. You’re looking for one that hits the upper barrier before the lower barrier within a finite window.
Zarattini & Aziz (2023) proved this mathematically: zero-edge random signals combined with Martingale sizing produce an 80% probability of 20% annual returns over 10,000 simulated accounts. Seventy-seven percent were profitable per year. Aggregate P&L: deeply negative.
Short-term pass rates and long-term edge are orthogonal problems.
Gambler’s Ruin with Asymmetric Barriers
The classical framework is gambler’s ruin between two absorbing barriers. For a pure random walk (zero drift):
P(hitting +P before −D) = D / (P + D)
With symmetric FTMO barriers (+10% / −10%), a zero-edge strategy has a 50% pass rate. Coin flip. Not terrible — you paid €540 for a coin flip on a €10,000 payout.
Add positive drift and the math tilts. Taranto & Khan (2020-2022) extended this to grid-constrained processes, showing that discrete trade sizing slows the ruin rate versus continuous random walks. Rodosthenous & Zhang (2020) solved the optimal stopping problem under maximum drawdown constraints — their key finding: the optimal approach involves periods of no trading combined with fixed take-profit targeting.
The 5% daily drawdown limit is the real killer. It constrains position sizing and makes aggressive strategies fragile. Most traders blow up here — not on total drawdown, but one bad day.
What We Actually Had
We’d spent months testing strategies. Most failed. Thirty-one strategies tested, four survived. The graveyard is extensive.
One price action strategy on EURUSD survived five rounds of progressive deflation — volume corrections, spread modeling, tick-level entry simulation, R:R sweeps, session filtering. Each round collapsed the numbers. Each round the edge persisted.
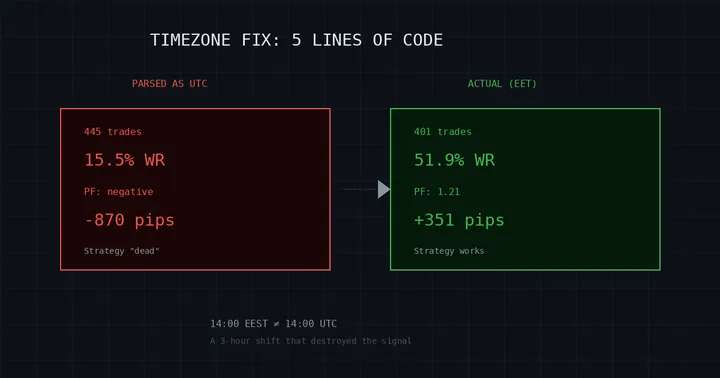
Update (March 2026): The original version of this post used backtest statistics from a Darwinex data source — 302 trades, 59.6% win rate, PF 1.48. Those numbers were wrong. When we re-ran the backtest on MT5 tick data (a different, more conservative data source), the results diverged significantly. The corrected numbers below are from the MT5 rebacktest. Data source matters. Always revalidate.
The honest floor after MT5 tick-level verification:
| Metric | Value |
|---|---|
| Trades | 401 (over 2.5 years) |
| Win Rate | 51.9% |
| Profit Factor | 1.21 |
| Risk:Reward | 1:1.5 |
| Avg Loss | ~8-9 pips |
| Session | London Open + NY Open |
Not spectacular. Barely above coin-flip win rate. But PF 1.21 means winners are larger than losers — the edge lives in asymmetry, not accuracy. And it survived a full data source migration without dying. That’s worth something.
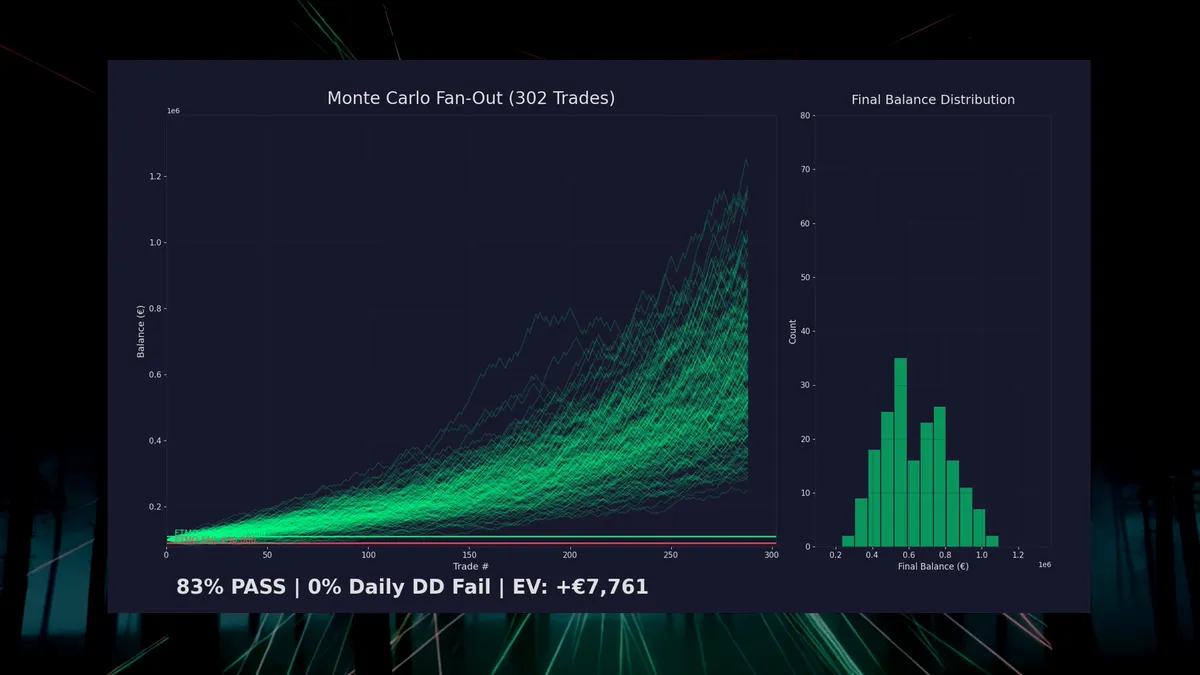
Monte Carlo Says: Possible, Not Easy
We ran 10,000 Monte Carlo simulations per risk level, sampling with replacement from the actual 401-trade R-multiple distribution. Each simulation:
- Starts at €100,000
- Draws trades randomly from the backtested distribution
- Applies the risk percentage to current balance (compounding)
- Checks FTMO constraints after every trade: 10% profit target, 10% max drawdown, 5% daily drawdown
- Records pass/fail/breach type
200 equity curve paths drawn from the backtested trade distribution. Green paths pass the FTMO challenge. Red paths breach the drawdown limit. The fan-out tells the story — most curves drift upward, but the barriers catch a lot of them before they get there.
The original post — using the inflated Darwinex numbers — showed an 83% pass rate at 2% risk. A beautiful result. Also wrong.
With honest MT5 numbers, the picture changes. The peak pass probability is 35% at 3.0% risk per trade, with a 57% bust rate. At lower risk levels, you don’t reach the profit target within the time window. At higher levels, the daily drawdown limit eats you. The sweet spot is narrow, and the probability at that sweet spot is roughly one-in-three.
That’s a long way from 83%.
What the Corrected Numbers Actually Mean
Here’s where it gets interesting — the framework doesn’t break, it just tells a different story.
A 35% pass rate on a single attempt isn’t great. But prop firm challenges are repeatable. Each attempt costs €540. You can keep buying tickets.
The cumulative probability of passing at least once across n attempts:
- 3 attempts: 73% cumulative pass rate
- 5 attempts: 89% cumulative pass rate
- Budget: €1,620 to €2,700 in challenge fees
So the question shifts from “will I pass?” to “can I afford to fail twice?” The call option metaphor holds — you’re buying multiple cheap options, each with a 35% chance of paying off. The expected payout remains positive. It’s just not a one-shot deal.
At a €10,000 funded extraction target, the EV per attempt:
EV = 0.35 × €10,000 − €540 = +€2,960Positive. Not the +€7,776 we originally claimed, but still a bet you’d take every time. Even at half extraction (€5,000):
EV = 0.35 × €5,000 − €540 = +€1,210Still positive. The option is still cheap relative to the payout. You just need capital for multiple attempts — and the discipline to execute mechanically each time.
Why the Numbers Were Wrong
Worth explaining, because the failure mode is instructive.
Darwinex and MT5 use different tick data providers. Small differences in spread modeling, gap handling, and price interpolation compound across 401 trades. The Darwinex data was more favorable — tighter effective spreads, more generous fills at session opens. The result: an 8-point win rate inflation (59.6% vs 51.9%) and a PF that looked 22% better than reality (1.48 vs 1.21).
We caught this during a routine revalidation — the kind of paranoid re-checking that feels tedious until it saves you from trading a fantasy. The lesson: any backtest is only as honest as its data source, and data sources disagree more than you’d think.
The Zarattini Point, Strengthened
Here’s the irony: the corrected numbers make the Zarattini argument stronger, not weaker.
Zarattini showed that zero-edge strategies can pass challenges 80% of the time through pure variance and aggressive sizing. Our strategy has a real edge (PF 1.21, validated on tick data across two independent data sources). And it only passes 35% of the time at optimal risk.
Why? Because we’re sizing conservatively enough to survive the daily drawdown constraint. Zarattini’s simulated traders used Martingale — they either doubled up to glory or exploded. That produces high pass rates and catastrophic funded-phase performance.
Our approach sacrifices single-attempt pass probability for survivability after passing. The strategy that gets you funded and the strategy that keeps you funded should be the same strategy at the same risk level. If you have to switch gears after passing, you never had an edge — you had a lottery ticket.
This is what separates positive EV from the Art of Financial Illusion.
What the Simulations Don’t Capture
- Execution slippage. Backtests assume fills at order price. Real markets fill worse, especially during London/NY sessions.
- Regime change. Validated on 2.5 years. Market structure shifts. No guarantee the next 401 trades resemble the last.
- Psychology. Monte Carlo doesn’t flinch, revenge-trade, or move stops. The human is the biggest variance source.
- Trade correlation. Sampling with replacement assumes independence. Real trades cluster — three losses in a choppy session, then a streak during a trend.
- Operational constraints. News trading restrictions, weekend gaps, minimum trading day requirements. Our simulation handles drawdown barriers but not every FTMO rule.
We run the strategy live on a VPS — zero human intervention, mechanical execution, 30-minute cycles. Same code as the backtest. But live and backtest remain different animals. Early live results (6 trades, 50% WR, PF 1.25) track the backtest within margin, which is encouraging but not conclusive.
The Meta-Strategy
The approach generalizes. Any strategy with positive expectancy, enough trades per month to reach the target, and validation on real market data can be Monte Carlo’d against prop firm constraints to find optimal risk allocation.
The strategy itself is almost irrelevant. What matters is the R-multiple distribution and position sizing. This is “starting from the end” — define the win condition, then optimize the single free variable that maximizes the probability of hitting it.
With weak edge, the answer is “budget for multiple attempts.” With strong edge, the answer is “one shot, optimal sizing.” Most honest strategies land somewhere in between.
Papers Worth Reading
- Zarattini & Aziz (2023), “The Art of Financial Illusion” — Proves you can pass challenges without alpha. The paper that should make every funded trader uncomfortable.
- Taranto & Khan (2020-2022), Absorbing Barrier Framework — Extends gambler’s ruin to grid-constrained processes. Theoretical backbone.
- Rodosthenous & Zhang (2020), “Optimal Stopping Under Drawdown” — When to stop trading during a challenge. Published in Mathematical Finance.
- Milanzi (2024), WPI Thesis — Empirical Monte Carlo on FTMO pass probability. Confirms: >95% of traders fail evaluations.
The Punchline
€540 buys a call option on variance. With honest numbers, it expires in the money 35% of the time — not 83%. Budget for three attempts and you’re at 73%. Five attempts, 89%.
Most people approach prop firms looking for the perfect strategy. We approached it looking for the perfect bet size. The corrected answer is less glamorous than the original: you need a real edge, conservative sizing, and the bankroll to try more than once.
The framework works. The math is sound. The original numbers weren’t. We’d rather publish the correction than let a flattering lie sit.
All simulations use actual trade R-multiples from tick-level backtests. No synthetic data. No curve fitting. The research code is public. The strategy specifics are not — that’s the edge.
This post was corrected in March 2026 after MT5 rebacktesting revealed data source divergence. The original version overstated pass probability by ~48 percentage points. The framework and methodology are unchanged; only the input statistics and resulting probabilities were updated.