On-Chain Data as Trading Signals: Funding Rates, OI, and Liquidation Zones
We built a cascade evaluator, calibrated 710+ events, and found cascade-fade alive on SOL (PF 1.44–2.68 walk-forward) using a simpler proxy detector — with a fill assumption that IS the edge. BTC is dead. Funding rates were never backtested standalone. The "nobody uses this data" claim was cope.
The Pitch
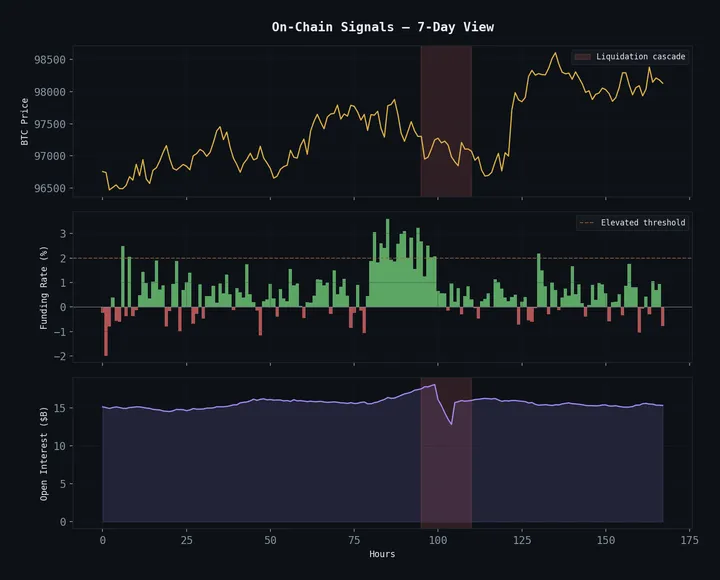
Crypto perpetual futures leak positioning data that traditional markets hide behind weekly COT reports and Bloomberg terminals. Funding rates tell you who’s paying whom. Open interest tells you how much money is in the game. Liquidation levels tell you where the forced selling sits.
The original version of this post said “nobody uses this data systematically.” That was cope. Quant funds absolutely use it — Jump, Wintermute, Alameda (RIP) had this wired into execution engines years ago. We just couldn’t find public research, which is different from nobody doing the research. The edge, if it exists, isn’t in having the data. It’s in the specific signal extraction.
We built three signal types. One is alive. One is dead. One was never actually tested.
Funding Rate Extremes: The Signal We Never Backtested
Positive funding = longs pay shorts (market is net long). Negative = shorts pay longs. Extreme funding should mean-revert — when everyone leans one way, the correction comes.
def funding_rate_signal(funding_history, lookback_hours=168, z_threshold=2.0):
    df = funding_history.copy()
    intervals = lookback_hours // 8  # 8-hour funding intervals
    df['cum_funding'] = df['funding_rate'].rolling(intervals).sum()
    df['funding_z'] = (
        (df['cum_funding'] - df['cum_funding'].rolling(intervals * 4).mean())
        / df['cum_funding'].rolling(intervals * 4).std()
    )
    df['signal'] = 0
    df.loc[df['funding_z'] > z_threshold, 'signal'] = -1   # fade longs
    df.loc[df['funding_z'] < -z_threshold, 'signal'] = 1   # fade shorts
    return df
We backfilled 90 days of funding history for 14 coins from Hyperliquid — 30,240 records. Then we profiled the distributions and found something embarrassing: our watcher’s hardcoded extreme threshold of 0.0005 was 40× too high.
The actual 95th percentile for most coins lives around 0.000013. BTC and ETH cluster near zero with almost no meaningful deviation. POL and some altcoins show wider tails, but even their extremes are an order of magnitude below what we were watching for.
Our “extreme funding detector” was waiting for events that essentially never happen. Like building a tsunami alarm that triggers at wave heights the ocean doesn’t produce.
The honest admission: we never backtested funding rate mean-reversion as a standalone signal. We profiled the data, found the threshold was broken, recalibrated it — and then moved on to cascade detection, which was more interesting. The funding signal sits in a drawer, properly calibrated but unvalidated. We don’t know if it works.
Open Interest Divergence: Data Collection, No Results
OI-price divergence — new money entering while price moves against those positions. Trapped traders who eventually capitulate.
def trapped_traders(df, oi_lookback=24, price_lookback=24):
    df['oi_change'] = df['open_interest'].pct_change(oi_lookback) * 100
    df['price_change'] = df['close'].pct_change(price_lookback) * 100

    # OI up + price down + positive funding = longs trapped
    df['trapped_longs'] = (
        (df['oi_change'] > 5) &
        (df['price_change'] < -1) &
        (df['funding_rate'] > 0.01)
    )
    # OI up + price up + negative funding = shorts trapped
    df['trapped_shorts'] = (
        (df['oi_change'] > 5) &
        (df['price_change'] > 1) &
        (df['funding_rate'] < -0.01)
    )
    return df
The logic is sound. Trapped traders capitulate. Capitulation drives violent moves. But this is theory, not results. Our collector runs every 30 minutes across 6 coins. We have data. We haven’t validated whether OI divergence actually predicts anything.
Not publishing results because there are no results to publish.
Liquidation Cascade Detection: The One We Actually Built
This is where we stopped hand-waving and built something real.
The cascade evaluator is a 4-gate pure Python system that scores panic conditions across five dimensions:
# Panic score components (centered at 50 = normal):
# - volume_score: log2-based spike detection vs 1h rolling baseline
# - price_velocity_score: absolute rate of price change
# - oi_change_score: sudden OI drops (positions liquidating)
# - funding_score: per-coin calibrated from distribution profiles
# - book_imbalance_score: bid/ask depth ratio via numpy
When the composite panic score crosses 60, the system fires a cascade alert with a directional call (long squeeze or short squeeze) and a recommended fade direction.
We calibrated this against 710+ historical cascade events. The evaluator works — it identifies real liquidation cascades with reasonable precision. The detection isn’t the problem.
The problem is what you do after you detect one.
The Cascade-Fade Scalper: Alive on SOL, Dead on BTC
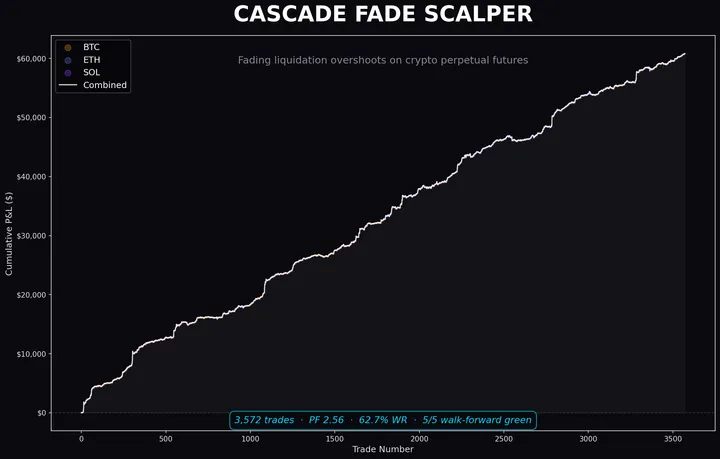
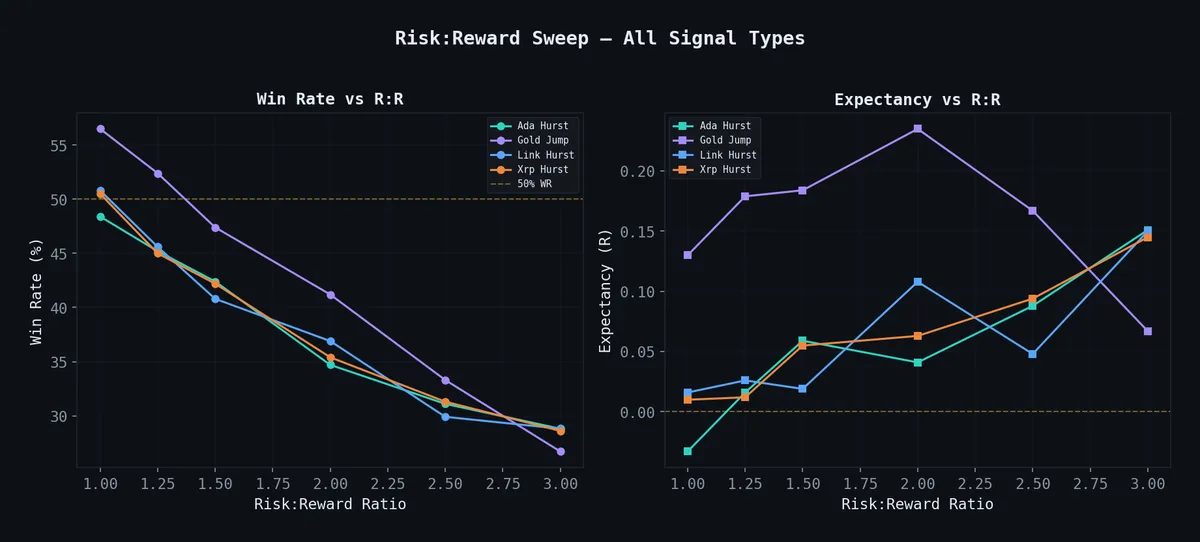
The trade thesis: when a cascade triggers, fade it. Liquidation cascades overshoot. The bounce-back is tradeable. Hold for 1-3 minutes and take the reversion.
Important distinction: the “alive” version does NOT use the full cascade evaluator (the 710+ event, 5-component panic scorer described above). Instead, it uses a much simpler OHLCV proxy detector — 5-bar price velocity + 3× volume spike — to identify cascade-like conditions from plain candlestick data. The cascade evaluator was built to understand liquidation physics. The proxy detector was built to trade them cheaply, without real-time WebSocket feeds.
Combined results (BTC + ETH + SOL):
| Metric | Value |
|---|---|
| Profit Factor | 2.56 |
| Trades | 3,572 |
| Hold time | 1-3 minutes |
| Status | Varies by asset |
PF 2.56 across 3,572 trades is the aggregate across all three coins, not SOL alone. Per-coin: SOL had the best edge (PF 3.18 best-case), ETH was the workhorse (PF 2.89), BTC the volume carrier (PF 2.00). On SOL specifically, mid-price walk-forward produced PF 1.44–2.68 — the range that matters for realistic execution.
But. And this is the kind of “but” that separates blog posts from P&L statements.
The fill assumption IS the edge. These are 1-3 minute holds during liquidation cascades — exactly the moments when orderbooks are thinnest, spreads are widest, and getting filled at your theoretical price is hardest. Under worst-case fill assumptions, the aggregate PF drops from 2.56 to 0.25.
Not 1.25. Not 0.85. 0.25. That’s losing 75 cents on every dollar. That worst-case is across all coins combined — per-coin, BTC was the truly dead one (PF 0.83–0.93 at mid-price fills). SOL held up better, with mid-price walk-forward PF of 1.44–2.68.
The real PF lives somewhere between best-case and worst-case. Where exactly depends on your infrastructure — colocation, order routing, maker rebates, how many other bots are running the same fade. If you’re on a retail connection hitting market orders through a web UI, you’re closer to worst-case. If you’re colocated with a custom gateway, you’re closer to best-case.
We’re being honest about this because most backtest reports give you the best-case number and bury the execution risk in a footnote. The execution risk is the story here.
BTC results — dead:
| Metric | Value |
|---|---|
| Profit Factor | 0.83–0.93 |
| Status | Dead |
BTC cascade-fade doesn’t work. Period. PF below 1.0 across every configuration we tested. The cascades are real, the fades don’t pay. BTC is too efficient, too liquid, too crowded with the same fade bots. By the time you detect the cascade and submit the order, the reversion is already priced in.
ETH results — fragile:
| Metric | Value |
|---|---|
| Green windows | 4 out of 5 |
| Dead windows | 1 out of 5 |
| Status | Fragile |
ETH cascade-fade is green in 4 out of 5 test windows and dead in 1. That single dead window isn’t a blip — it’s structural fragility. A strategy that works 80% of the time and blows up 20% of the time isn’t robust, it’s a landmine with a good track record.
We wouldn’t trade ETH cascade-fade without solving the dead-window problem, and we haven’t solved it.
Early Calibration: The Cold-Start Problem
The first two live alerts were both false positives:
- BTC panic 68.5 — cold-start artifact. Volume baseline was empty after restart. A normal tick registered as a spike. Fixed with 15-minute warmup dampening.
- XRP panic 62.8 — same issue. Volume score pegged at 100 while everything else was baseline.
The cascade evaluator needs 4-6 hours of data to normalize its rolling baselines. Before that, it hallucinates cascades in normal market conditions. This is documented because it matters for anyone building similar systems: your first day of alerts is garbage.
What’s Real About On-Chain Data
Crypto on-chain data has genuine structural advantages over traditional positioning data:
- Real-time. Funding every 8 hours. OI continuously. Compare to weekly COT reports that arrive 3 days late.
- Permissionless. No Bloomberg terminal. No vendor contracts. Free and open from every exchange API.
But the advantage isn’t access — every quant fund and every bot farm has this same data piped into the same models. The advantage, if one exists, is in signal extraction and execution. You’re not competing against traders who glance at funding rates on a dashboard. You’re competing against firms that had this automated before DeFi summer.
What This Taught Us
-
Calibrate from data, not intuition. Our funding watcher threshold was 40× too high because someone picked a round number instead of profiling the actual distribution. Always compute your thresholds from the data. Intuition about “extreme” is worthless.
-
Fill assumptions are not details. On the cascade-fade, the difference between best-case and worst-case fills is PF 2.56 vs PF 0.25 in aggregate. A factor of 10×. The strategy is alive or dead depending entirely on execution infrastructure, not signal quality. Any scalper backtest that doesn’t stress-test fill assumptions is fiction.
-
Edges are asset-specific. SOL cascade-fade works. BTC cascade-fade is dead. ETH is fragile. Same signal, same logic, same evaluator — completely different results per asset. If your backtest shows “this works on crypto,” ask which crypto.
-
Detection ≠ trading. We built a cascade evaluator that genuinely identifies liquidation events (710+ calibrated). That’s engineering. Turning cascade detection into profitable trades is a different, harder problem that depends on execution speed, fill quality, and how many other participants are running the same fade.
-
“Nobody does this” is usually wrong. The original version of this post implied retail traders had a unique edge because they could access on-chain data. They can. So can everyone else. The data is free. The alpha is in what you do with it, and the firms with $100M in infrastructure do more with it than you.
The cascade evaluator works for detection. The cascade-fade scalper — which uses a simpler OHLCV proxy detector, not the full evaluator — is alive on SOL with an asterisk the size of your execution stack. BTC is dead. ETH is fragile. Funding rates were never tested. The on-chain data advantage is real but crowded.
That’s what we actually know. Everything else is marketing.
This data feeds into our LLM Trading Agent. For the broader approach, see Markets Are Languages, Not Physics. For more honest postmortems, see 31 Strategies Tested, 4 Survived.